Thinking about buying in Natick or the wider MetroWest area and not sure where to start? You are not alone. The market has shifted since the low‑rate rush of 2020–21, and the right move today depends on inventory, commute options, and the trade‑offs between condos and single‑family homes. In this guide, you will learn how to read the trends that matter in Natick and nearby towns, how price‑per‑square‑foot works, and what to check on every tour. Let’s dive in.
MetroWest inventory and seasonality
Inventory across MetroWest has been uneven. You will often find more condos and townhomes near downtowns and commuter‑rail stations, with tighter supply for turnkey single‑family homes in popular neighborhoods. That split matters when you set expectations for what you can see at your price point.
Seasonality still plays a big role. Winter usually shows the lowest active inventory, while spring brings more new listings and showings. If you are flexible on timing, plan for a deeper search in spring and early summer and a more selective hunt in late fall and winter.
Watch day‑to‑day signals. Days on market, price reductions, and seller concessions are your most useful clues about local temperature. These indicators can vary by block, so ask for a neighborhood‑level view rather than a single townwide snapshot.
Price‑per‑square‑foot basics in Natick
Price‑per‑square‑foot, or PPSF, helps you compare homes of different sizes, but it works best inside the same property type. For example, compare condos to condos, and single‑family homes to single‑family homes. Use PPSF as a guide, not a final valuation.
For accuracy, focus on recent solds. Ask your agent to pull a rolling 6 to 12‑month set of similar sales within a tight radius. Filter to like‑for‑like homes that match property type, finished living area, bedroom and bath count, and land characteristics. The median PPSF is usually more reliable than an average because it reduces the impact of outliers.
Expect PPSF bands to shift with location and condition. Properties close to transit, recent renovations, efficient layouts, and strong amenities tend to command higher PPSF. Condos often show higher PPSF than single‑family homes due to smaller sizes and onsite amenities, even when the total price is lower.
Transit impact on value in Natick
Natick benefits from two MBTA Framingham/Worcester Line stations: Natick Center and West Natick. If you plan to commute to Boston, proximity to these stations can influence both demand and pricing.
Station access often adds a premium. Walkable distance, reliable peak service, and travel time to Boston are key. A difference of 10 to 20 minutes in commute time or the need for transfers can change buyer interest. For many commuters, the presence of park‑and‑ride options and the ease of first and last mile connections also matter.
Consider driving routes as a back‑up. Access to I‑90, Route 9, and Route 128/95 can make Natick appealing if you split time between rail and car. If station parking is limited, homes very close to the platform may see additional demand from buyers who value a quick walk over hunting for a space.
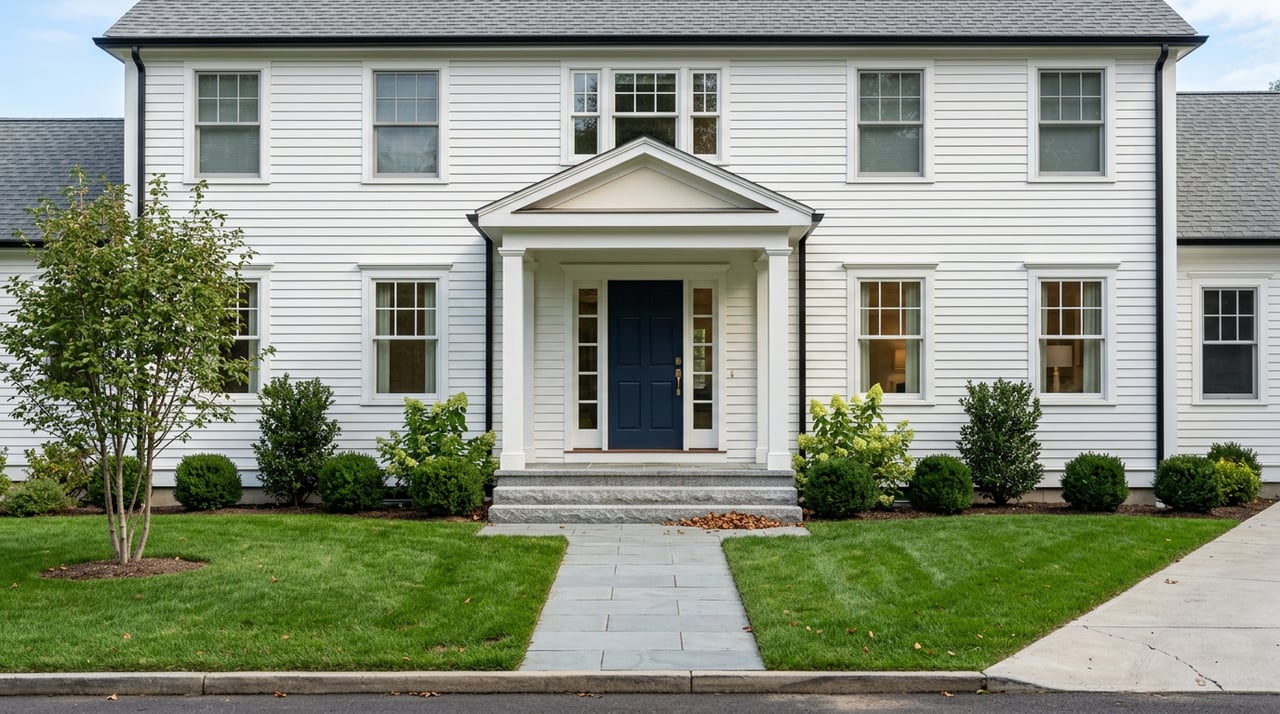
Condo vs single‑family trade‑offs
Natick offers a classic MetroWest mix: established single‑family neighborhoods and a meaningful supply of condos and townhomes near downtown and the stations. Your choice depends on lifestyle, budget, and appetite for maintenance.
Condos and townhomes
- Pros: more options near transit and downtown, lower exterior maintenance, and predictable amenities.
- Cons: HOA fees, special assessments, potential rental restrictions, and dependence on the association’s reserve fund and insurance.
- Due diligence: review bylaws, recent meeting minutes, reserve studies, master insurance, special assessments, rental caps, and parking allocations.
Single‑family homes
- Pros: more land and privacy, room to expand, and strong neighborhood identity.
- Cons: higher maintenance and capital expenses for systems like roof, HVAC, and sometimes septic.
- Due diligence: full inspection, structural and roof history, HVAC age and service records, water and septic reports if applicable, and permit history for additions and finished space.
Price dynamics
- Condos may show higher PPSF but lower total prices compared with single‑family homes. Single‑family homes carry higher absolute prices and respond more to lot size and neighborhood context.
- Your budget will guide the trade‑off. If you want a short commute and walkability, a condo near Natick Center or West Natick can be a strong fit. If outdoor space and privacy are top priorities, you may look to single‑family options in outer Natick or nearby towns.
Natick vs Cambridge, Newton, and Framingham
When you compare towns, use consistent metrics pulled from the same time frame and source. Ask for median sale price, median PPSF, median days on market, and the share of condo versus single‑family sales in the last 6 to 12 months.
Cambridge
- Character: urban hub with a high share of condos and multi‑family homes.
- Pricing: among the higher PPSF levels in Greater Boston, driven by demand from nearby employment centers.
- Commute: fast access to Boston via rapid transit.
Newton
- Character: suburban with village centers and a large single‑family presence, plus some condos near village cores.
- Pricing: higher absolute prices are common for single‑family homes.
- Commute: multiple transit options and strong road access shorten trips to Boston.
Natick
- Character: classic MetroWest town with a vibrant downtown and two commuter‑rail stations.
- Pricing: mid to upper ranges within MetroWest, with station‑proximate homes often seeing premiums.
- Commute: rail to Boston on the Framingham/Worcester Line and convenient highway access.
Framingham
- Character: larger regional center with more inventory and a broad mix of property types.
- Pricing: often more affordable PPSF than Natick or Cambridge, which attracts buyers seeking value.
- Commute: major commuter‑rail stop and highway access, though some trains take longer to reach Boston.
Ask for the right data
To stay grounded, request these specific reports for your target neighborhoods and property types. Aim for rolling windows so you see trend direction, not just a moment in time.
- Median sold price and median PPSF, last 6 to 12 months, by condos and single‑family homes.
- Active listings today, plus new listings added in the last 30 and 90 days.
- Median days on market and the share of listings with recent price reductions.
- The percentage of sales that are condos versus single‑family over the last 12 months.
- Sold examples within 0 to 0.5 mile, 0.5 to 1 mile, and 1 to 2 miles of Natick Center and West Natick stations, including sale price, PPSF, and days on market.
How to use PPSF the right way
Here is a quick method you can use with your agent on each property you like.
- Compute PPSF on the home you are touring by dividing the list price by finished living area. Exclude unfinished basements unless they are finished space.
- Compare to the median PPSF from recent similar solds within a small radius. Note the sample size and date range.
- Adjust mentally for layout, condition, outdoor space, and special features like a recent renovation or architect‑designed addition.
- Treat this as directional. A well‑designed 1,800‑square‑foot home can out‑perform a larger but inefficient layout even at a higher PPSF.
Touring checklist for Natick buyers
Use this quick list to keep your tours focused and objective.
- Confirm commute: check the MBTA schedule for your specific train times, platform, and parking options at Natick Center or West Natick.
- Map the walk‑shed: measure the walk from the home to the station or to key services, and note first and last mile options such as bike routes or ride‑hailing.
- Run the PPSF: compare the home’s PPSF to recent similar solds. Ask for medians over the last 6 to 12 months.
- Probe maintenance: roof age, HVAC age and type, foundation condition, and any signs of water intrusion.
- Verify permits: look up building permits on any additions, finished basements, or major system replacements.
- For condos: review HOA bylaws, minutes, reserve study, master insurance coverage, and any special assessments in the last 5 years.
- Taxes and assessments: request the latest tax bill and note assessment trends from the local assessor.
- Neighborhood plans: ask about any pending zoning changes or large nearby developments.
Smart next steps
If Natick is on your list, start by narrowing to a few neighborhoods and one property type. From there, request the rolling 6 to 12‑month medians for price and PPSF, plus commute‑zone sold examples around Natick Center and West Natick. With that data in hand, you will spot fair value quickly and move with confidence when the right home appears.
Ready to talk strategy or get neighborhood‑level data for your search? Connect with the team at Marika & Adam Real Estate Group for a personalized plan and a clear path from touring to closing.
FAQs
What is price‑per‑square‑foot in Natick and how should I use it?
- Use PPSF as a directional guide by comparing recent similar solds within a tight radius, and lean on the median over the last 6 to 12 months for accuracy.
How does living near Natick Center or West Natick stations affect pricing?
- Walkable proximity and reliable peak service often add a premium, and shorter travel times to Boston can increase buyer demand and PPSF.
Is inventory increasing right now in Natick and MetroWest?
- Check rolling 3, 6, and 12‑month counts of active and new listings, plus days on market and recent price reductions for the most current read.
Are condos a better value than single‑family homes in Natick?
- Condos often show higher PPSF but lower total prices, while single‑family homes hinge more on lot and neighborhood; compare all‑in costs including HOA fees.
How do commute options compare across Natick, Newton, Cambridge, and Framingham?
- Cambridge and Newton offer faster rapid transit or multiple options, while Natick and Framingham rely on commuter rail and highways with differing trip times.
What data should I ask my agent to pull before I make an offer?
- Request median price and PPSF for the last 6 to 12 months, days on market, list‑to‑sale ratios, price‑reduction rates, and station walk‑shed sold examples.